Lessons Learned from the 30 Day Chart Challenge 2025
post
rstats
ggplot
dataviz
chartchallenge
denmark
education
higher education
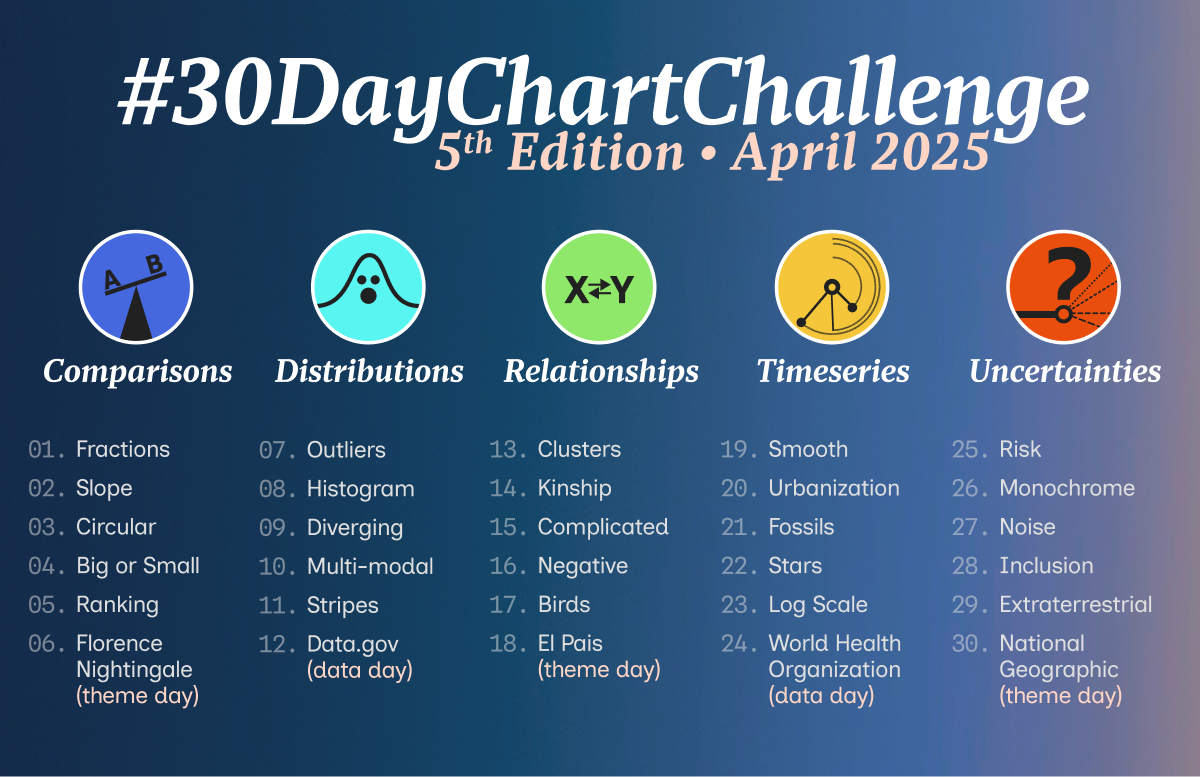
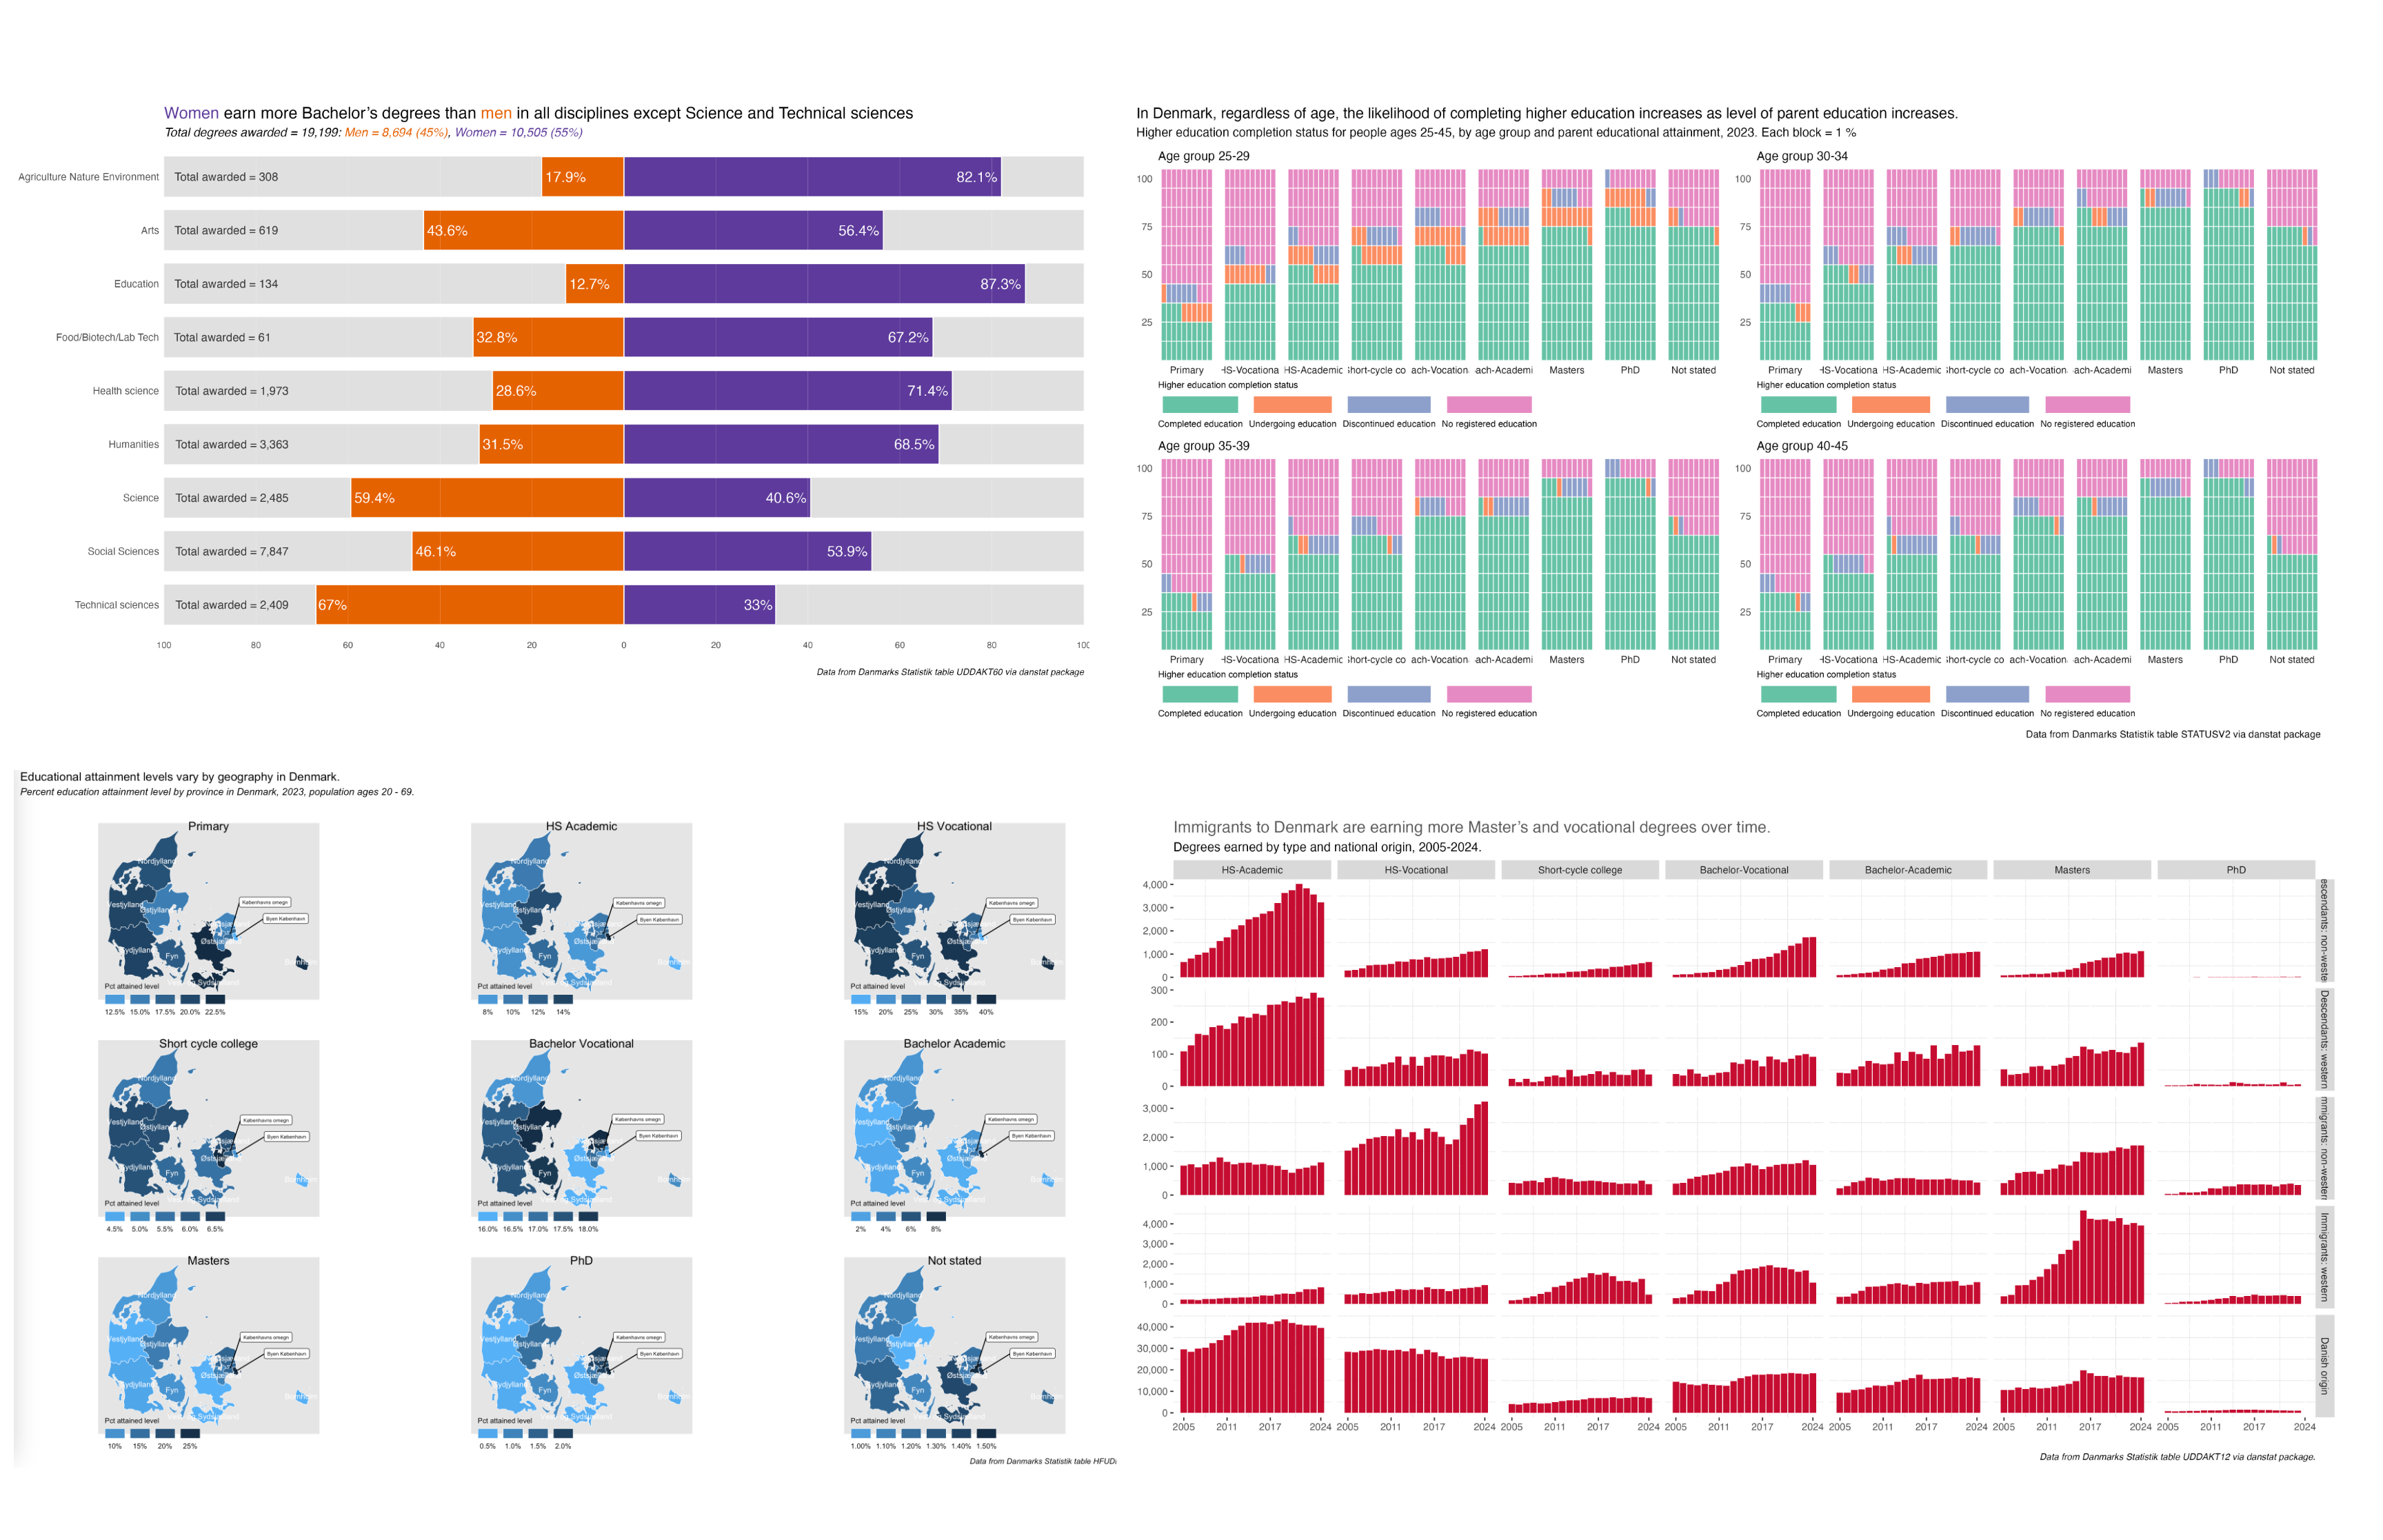
30 Day Chart Challenge 2025
post
rstats
ggplot
dataviz
chartchallenge
denmark
education
higher education

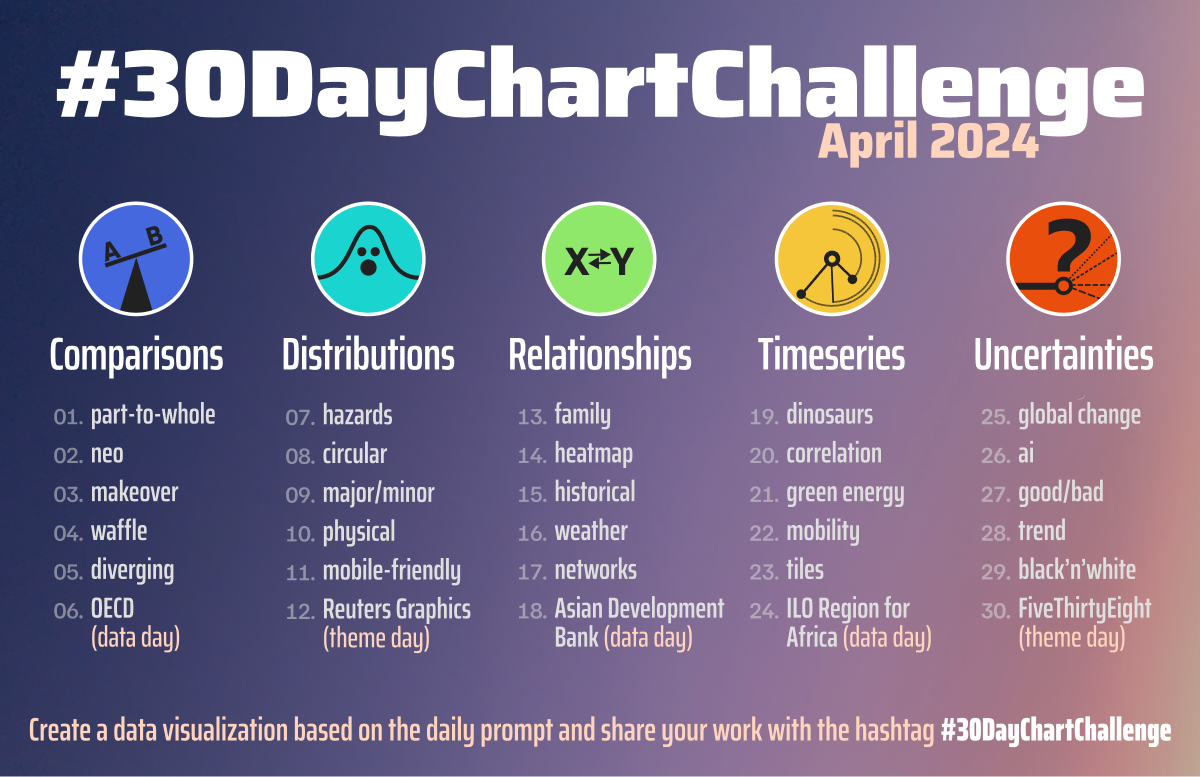
30 Day Chart Challenge 2024
post
rstats
ggplot
dataviz
chartchallenge
tidytuesday
eurostat
oecd
spotify
denmark
crime
births
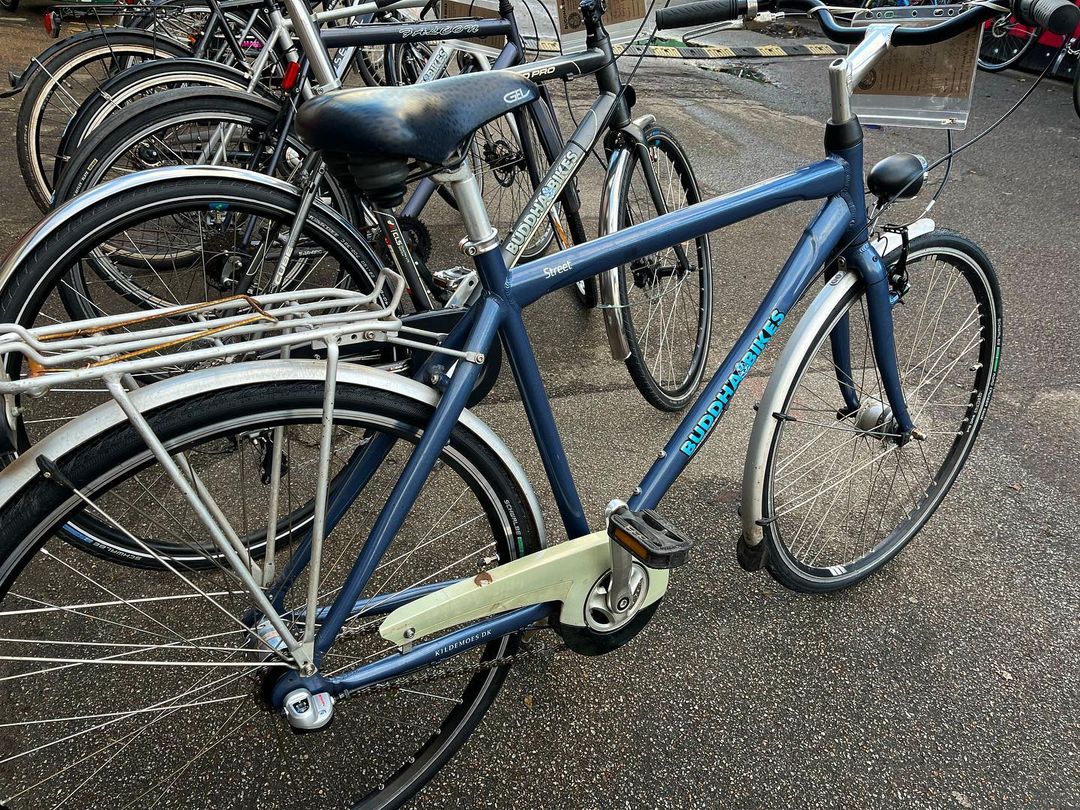
My Year of Riding Danishly pt 2
post
rstats
ggplot
regression
ols
bicycle
denmark

Quick Note on Quarto Blogs and GDPR
post
news
privacy
GDPR
cookies

My Year of Riding Danishly
post
rstats
eda
ggplot
regression
ols
bicycle
denmark


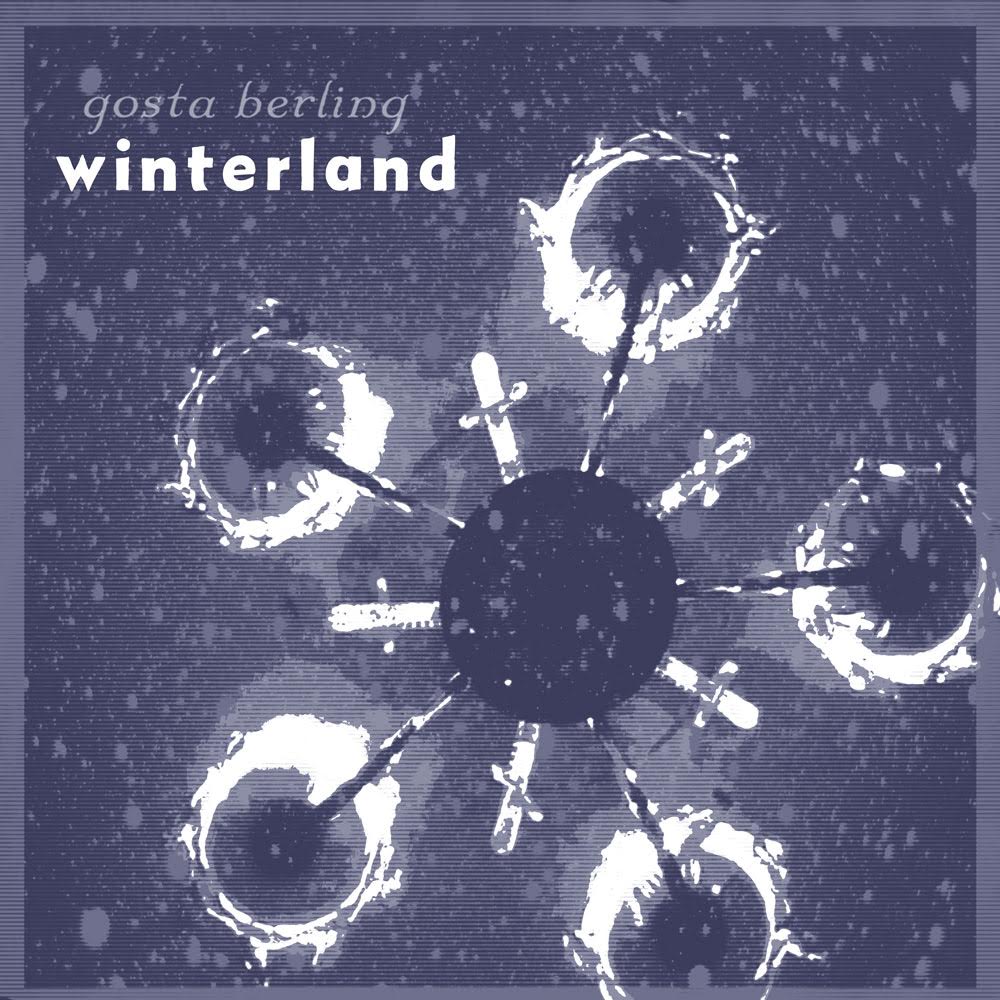
Sad Songs & Pretty Charts - a Gosta Berling Music Data Visualization
post
rstats
ggplot
dataviz
data visualization
music
spotify
gosta berling

Invited Talk at University of San Francisco, February 2020
post
rstats
ggplot
dataviz
data visualization
higher education

Tidy Tuesday, February 2, 2021 - HBCU Enrollment
post
tidytuesday
rstats
ggplot
dataviz
data visualization
higher education

Tidy Tuesday, April 07, 2020 - Le Tour! (Stage 2, charts!)
post
tidytuesday
rstats
ggplot
dataviz
data visualization
sports
cycling
tour de france

Tidy Tuesday, April 07, 2020 - Le Tour! (Stage 1, cleaning the data)
post
tidytuesday
rstats
sports
cycling
tour de france
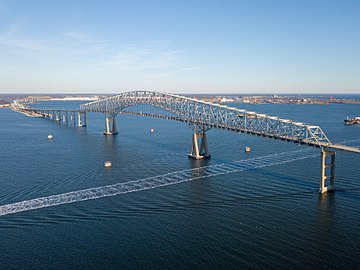
Tidy Tuesday, November 27, 2018 - Maryland Bridges
post
tidytuesday
rstats
ggplot
dataviz
data visualization

Tidy Tuesday, November 24, 2020 - Hiking Trails in WA State
post
tidytuesday
rstats
ggplot
dataviz
data visualization

No matching items